Chemical Sector Tops Exports in First 8 Months
According to Turkish Exporters Assembly (TİM) data, Türkiye's exports rose by 2.4 percent in August compared to the same period last year, reaching 22.1 billion dollars, setting an August record. The chemical sector, meanwhile, achieved 2.6 billion dollars in exports in August, ranking as the second highest exporting sector. In the January-August period, the sector recorded a 7.7 percent increase, becoming the sector with the highest export growth over the first eight months.
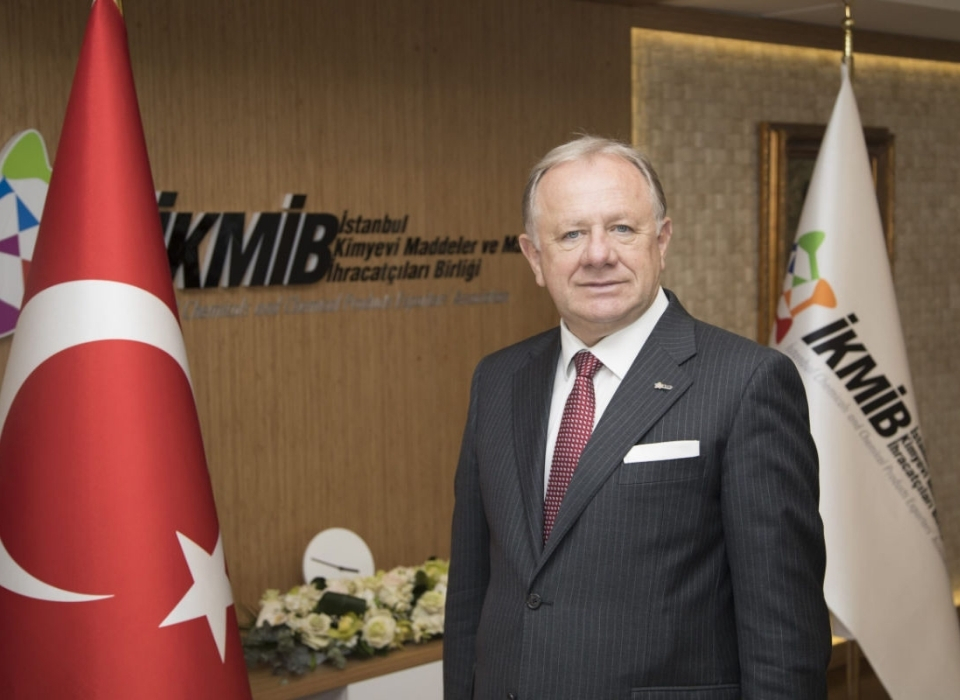
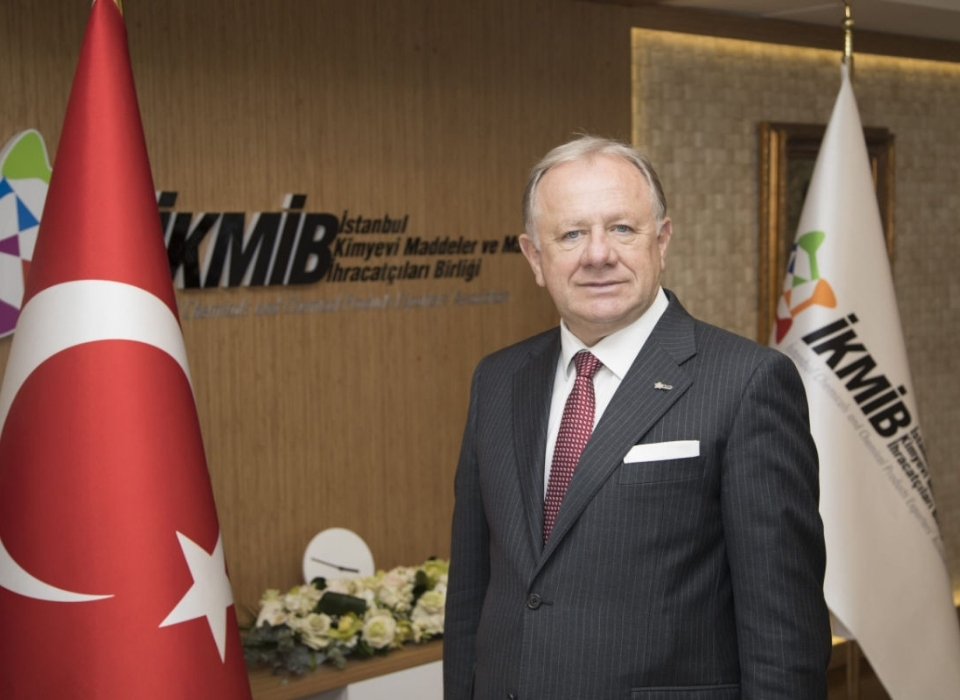
Evaluating the chemical sector's August export figures, Istanbul Chemicals and Chemical Products Exporters' Association (İKMİB) Chairman of the Board Adil Pelister said, "In August, our chemical sector achieved 2.6 billion dollars in exports, maintaining its position as the 2nd highest exporting sector among all sectors. In the first 8-month period, our sector's exports reached 21 billion dollars. Our sector increased its exports by 7.7 percent during this period, becoming the sector that increased its exports the most among all sectors. Exports also contributed to our country's growth in the second quarter. As announced by our Minister of Trade, half of the growth in the second quarter of the year came from net exports of goods and services. As one of the sectors contributing most to our country's growth, while supporting the measures taken within the scope of combating inflation, our sector needs state support, legal regulations and financing facilities during the economic recovery process. We believe we will overcome this process by struggling together in unity and solidarity. We will continue to work in order to reach our targets and continue to contribute to our country," he said.
The most exported product group in August was "plastics and articles thereof"
Among chemicals and chemical products groups in August, exports of plastics and articles thereof ranked first in chemical exports with 857 million 511 thousand dollars. Mineral fuels and products ranked second with 542 million 331 thousand dollars in exports, while inorganic chemicals exports ranked third with 253 million 204 thousand dollars. Following 'inorganic chemicals', the other sectors in the top ten were: 'essential oils, cosmetics and soap', 'rubber, rubber articles', 'paint, varnish, ink and preparations', 'pharmaceutical products', 'miscellaneous chemical substances', 'washing preparations' and 'organic chemicals'.
Romania was the country with the highest exports in August
In August, the country with the highest exports was Romania with 236 million dollars. The top ten countries with the highest exports in August were Romania, the Netherlands, Russia, the USA, Iraq, Germany, Italy, Egypt, the United Kingdom and Spain. Among the top 10 countries in August, the highest increase was in Egypt with 117.31 percent.
2024 chemical exports on a monthly basis
|
MONTH |
2023 VALUE ($) |
2024 VALUE ($) |
DIFFERENCE (%) |
|
January |
2.299.003.029,07 |
2.367.256.050,49 |
% 2,97 |
|
February |
2.261.956.042,17 |
2.617.207.325,49 |
% 15,71 |
|
March |
2.879.962.087,77 |
3.077.097.725,11 |
% 6,85 |
|
April |
2.381.533.446,92 |
2.495.889.529,82 |
% 4,80 |
|
May |
2.438.874.931,27 |
3.018.841.357,81 |
% 23,78 |
|
June |
2.383.546.414,36 |
2.231.797.665,63 |
% - 6,37 |
|
July |
2.172.860.290,96 |
2.589.720.108,78 |
% 19,18 |
|
August |
2.657.908.866,30 |
2.576.174.566,57 |
% -3,08 |
|
TOTAL |
19.475.645.109 |
20.973.984.330 |
% 7,69 |
Countries with the highest chemical exports in August 2024
|
NO. |
Country |
AUGUST 2023 VALUE ($) |
AUGUST 2024 VALUE ($) |
CHANGE IN VALUE (%) |
|
1 |
ROMANIA |
146.421.517,04 |
236.657.783,93 |
% 61,63 |
|
2 |
NETHERLANDS |
213.408.510,53 |
151.180.385,56 |
% -29,16 |
|
3 |
RUSSIA |
143.833.438,17 |
135.446.336,97 |
% -5,83 |
|
4 |
USA |
125.855.592,52 |
112.677.516,10 |
% -10,47 |
|
5 |
IRAQ |
119.554.756,04 |
109.780.852,57 |
% -8,18 |
|
6 |
GERMANY |
103.459.508,00 |
107.450.002,15 |
% 3,86 |
|
7 |
ITALY |
88.834.615,57 |
97.287.047,73 |
% 9,51 |
|
8 |
EGYPT |
38.245.868,81 |
83.113.107,77 |
% 117,31 |
|
9 |
UNITED KINGDOM |
74.823.048,30 |
79.319.639,67 |
% 6,01 |
|
10 |
SPAIN |
87.506.364,91 |
73.750.950,47 |
% -15,72 |
Sub-sectors in chemical sector exports in August 2024
|
|
|
|
2023 -2024 |
|
|
AUGUST 2023 |
AUGUST 2024 |
% DIFF. |
|
PRODUCT GROUP |
VALUE ($) |
VALUE ($) |
VALUE |
|
PLASTICS AND ARTICLES THEREOF |
801.672.183 |
857.511.816 |
% 6,97 |
|
MINERAL FUELS, MINERAL OILS AND PRODUCTS |
742.340.031 |
542.331.893 |
% -26,94 |
|
INORGANIC CHEMICALS |
204.045.409 |
253.204.993 |
% 24,09 |
|
ESSENTIAL OILS, COSMETICS AND SOAP |
186.013.874 |
188.917.795 |
% 1,56 |
|
RUBBER, RUBBER ARTICLES |
132.862.126 |
133.458.944 |
% 0,45 |
|
PAINT, VARNISH, INK AND PREPARATIONS |
129.608.834 |
132.689.691 |
% 2,38 |
|
PHARMACEUTICAL PRODUCTS |
108.190.408 |
122.013.542 |
% 12,78 |
|
MISCELLANEOUS CHEMICAL SUBSTANCES |
101.697.680 |
104.564.430 |
% 2,82 |
|
WASHING PREPARATIONS |
75.263.984 |
84.111.577 |
% 11,76 |
|
ORGANIC CHEMICALS |
72.862.277 |
72.224.826 |
% -0,87 |
|
ADHESIVES, GLUES, ENZYMES |
46.037.540 |
43.753.488 |
% -4,96 |
|
FERTILIZERS |
53.684.528 |
38.808.308 |
% -27,71 |
|
GUNPOWDER, EXPLOSIVES AND DERIVATIVES |
1.570.727 |
1.170.038 |
% -25,51 |
|
PRODUCTS USED IN PHOTOGRAPHY AND CINEMATOGRAPHY |
1.751.490 |
1.118.683 |
% -36,13 |
|
GLYCERIN, VEGETABLE PRODUCTS, DEGRAS, FATTY SUBSTANCES |
293.013 |
274.687 |
% -6,25 |
|
PROCESSED ASBESTOS AND MIXTURES, ARTICLES THEREOF |
14.765 |
19.857 |
% 34,48 |
|
TOTAL |
2.657.908.866 |
2.576.174.567 |
% -3,08 |
Gallery