Reactant Controlled Calcium Carbonate Production in the Presence of Propionic Acid
Abtsract
In this study, the morphology of calcium carbonate (
CaCO3) crystals synthesized in the presence of propionic acid (PA) was investigated by XRD and SEM analysis, and BET specific surface areas were determined.
According to the result obtained, CaCO3 were obtained in calcite form by using the initial reactant concentration between 0.2 M and 0.1 M in the presence of 0.05 M PA. Synthesized CaCO3 with the use of initial reactant concentration of 0.1 M or less were obtained as a mixture of vaterite and calcite forms.
The vaterite is formed as hollow spheres consisting of nano-sized particles. Due to the vaterite formed by decreasing the concentration of 0.1 M, the BET specific surface area began to be measured around 19 m²/g.
1. Introduction
CaCO3 is one of the most widely used materials in the paint and coating industries today [1]. Due to its ease of application, water-based paints are preferred over solvent-based
systems.
Apart from water and polymeric binder, inorganic fillers are used as functional pigments or placeholder extenders, and as the third main component of water-based
coatings [2].
The cost of water-based paints is reduced by adding fillers. Among the different fillers available, CaCO3 as filler is widely used because of its availability and low cost [3].
CaCO3 is non-toxic. Its density is low, its whiteness value is high and it is resistant to weather conditions [4].
Apart from all these features, its interaction with the binder, pigment and other components in the paint system is minimal. The most important feature of CaCO3 is that it can be produced in grain distribution and fineness suitable for all desired processes. This feature makes it useful for regulating physical properties such as dispersion, gloss, and hiding power [5].
While scientists are examining various parameters for CaCO3 production with desired properties [6], the effects of additives on CaCO3 production have attracted attention
since the effects of additives used during crystallization on synthesized crystal morphology and dimensions are known [7, 8]. There are also different studies on the synthesis
of CaCO3 in the presence of PA [9].
2. Material and Method
2.1 Material
In the study, calcium chloride dihydrate (CaCl2.2H2O, 99.5% ACS) and sodium carbonate (Na2CO3, 99.9% ACS) used for the reaction were obtained from Merck. PA (99%) used as
additive was obtained from Sigma-Aldrich.
2.2 Method
CaCl2.2H2O and Na2CO3 solutions, which were used to synthesize CaCO3 in the experiments, were mixed in a 1 L double-walled glass reactor and the reaction was continued for 15 minutes. During the reaction, the temperature of the reactor was kept constant at 25°C with a circulating water bath and at 400 rpm with a magnetic stirrer.
In order to examine the effect of the change in the initial reactant concentration on the CaCO3 crystal size and morphology in the presence of additives, the PA concentration was kept constant at 0.05 M in all experiments.
The initial reactant concentrations were equimolar and the concentrations were chosen as 0.2; 0.175; 0.15; 0.1; 0.075; 0.05 M. The residue was filtered through a membrane filter and after washing, it was dried in a vacuum oven at 80°C overnight.
XRD, SEM and BET analyzes of the powder obtained after drying were performed. XRD structural analysis of the material was performed by scanning the X-ray diffraction Bruker D8 Discover instrument 2θ values between 10° and 90°θ SEM images were taken using a Carl Zeiss Sigma 300 VP scanning electron microscope. BET specific surface areas of the synthesized materials were measured using the Quantachrome Nova Touch LX4 instrument.
Before the BET specific surface measurements, degas treatment was performed and this process was continued for 10 hours at 80°C. Calculations of specific surface area were found based on multi-point nitrogen adsorption isotherm measurements at 77K.
3. Results and Discussions
As the amount of Ca2+ and CO3 2- ions in the reactor environment decreases by decreasing the initial reactant concentration, the amount of material synthesized by reacting decreases.
It has been observed by following conductivity measurements that 0.05 M PA, used as an additive at relevant concentrations, has no effect on stopping or delaying the reaction.
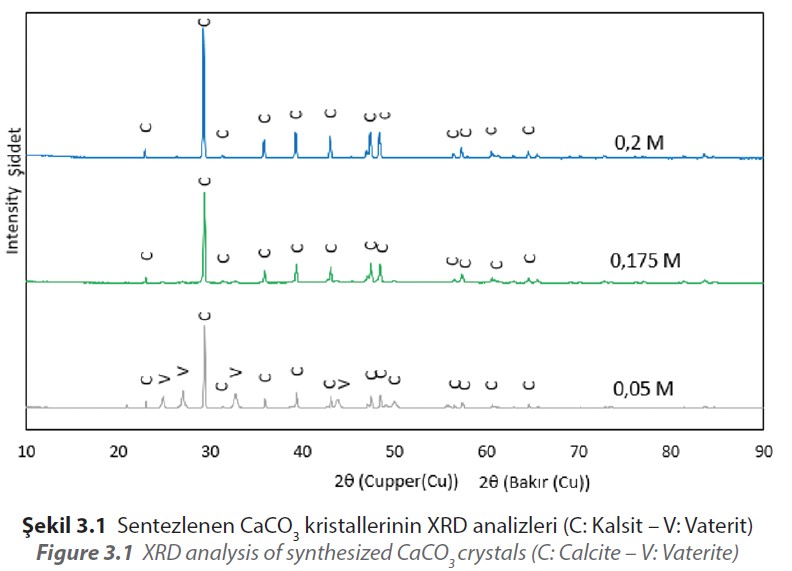
It is understood that CaCO3 is synthesized as a result of XRD analysis of the materials produced in the presence of PA. XRD analyzes of CaCO3 materials synthesized at initial reactant concentrations of 0.2, 0.175 and 0.05 M in the presence of PA are given in Figure 3.1.

As a result of the comparison made from the ICDD database for the synthesized materials, it is seen that the calcite peaks match with JCPDS 98-006-0995, and the vaterite peaks
match with JCPDS 98-000-6034.
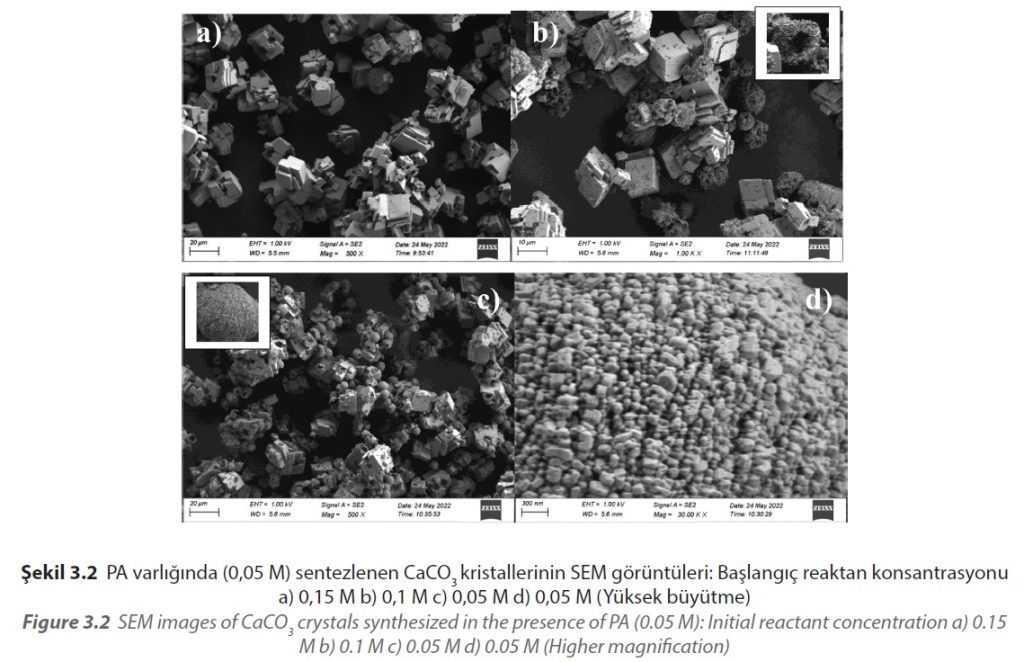
It is seen that CaCO3 synthesized by using the initial reactant concentration as 0.15 M in the presence of 0.05 M PA, consists of cubic agglomerated calcite crystals (Figure 3.2a). It is seen that the surfaces of the synthesized calcite crystals by examining the SEM images are clean and smooth.
Vaterite crystals are formed as hollow spheres together with agglomerated cubic calcite crystals by using the initial reactant concentration as 0.1 M at 0.05 M PA concentration (Figure 3.2b). SEM analysis shows that there are deformations on the surfaces of the synthesized calcite crystals.
In the presence of 0.05 M PA, using the reactant concentration as 0.05 M, the mixture of calcite and vaterite forms were obtained as 0.1 M as in the experiments (Figure 3.2c). It is
also seen in SEM analyzes that vaterite spheres are formed by the agglomeration of nano-sized crystals (Figure 3.2d).
Investigating the SEM images, it appears that the average crystal size decreases when the initial reactant concentration is reduced from 0.15 M to 0.05 M.

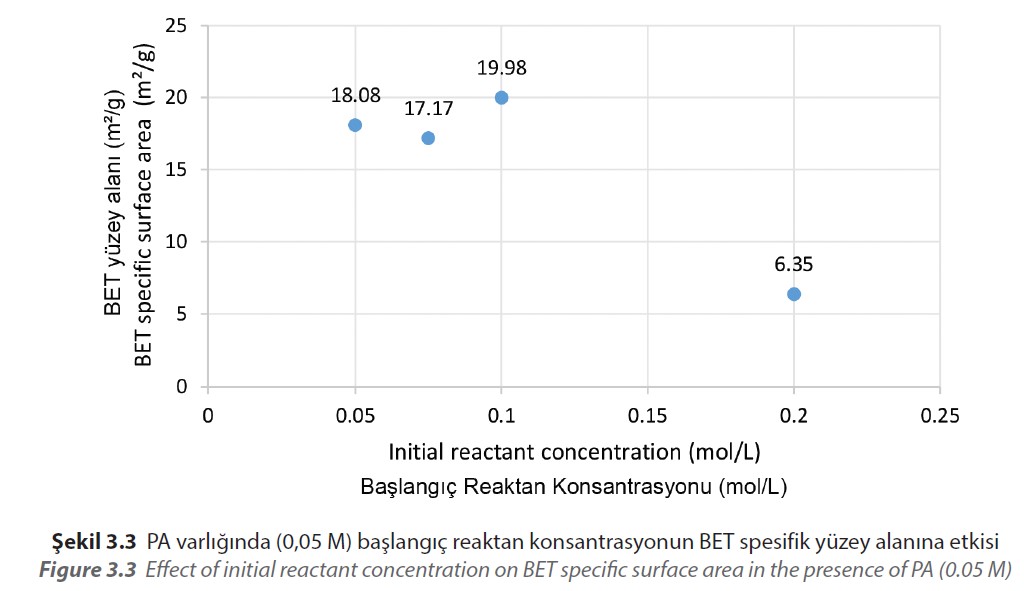
The BET specific surface area measurements of the obtained materials show that the specific surface area increases from 6.35 m²/g to 19.98 m²/g as the initial reactant
concentration reaches from 0.2 M to 0.1 M (Figure 3.3).

4. Conclusion
In this study, CaCO3 was rapidly synthesized using CaCl2 and Na2CO3 solutions in the presence of PA used as additive. Morphologies and sizes were determined by XRD and SEM
analysis, and BET specific surface areas were measured using nitrogen adsorption isotherms.
XRD analyzes of the synthesized materials in all experiments where the PA concentration
was set to 0.05 M confirm that pure CaCO3 was synthesized. With an initial reactant concentration of 0.15 M, the crystal morphology is entirely in the form of agglomerated
cubic calcite.
Using concentrations at 0.1 M and 0.05 M values, the calcite form is accompanied by vaterite that the form of obtained hollow spheres by combining nanosized structures.
The BET specific surface area value increases with decreasing initial reactant concentration, which is presumed to be due to the formation of hollow vaterite spherical forms. The main reason for the change in morphology and BET surface areas is that the PA concentration used as an additive is effective at these concentrations.
References
[1] V. Alvarez and M. Paulis, “Effect of acrylic binder type and calcium carbonate filler amount on
the properties of paint-like blends,” Prog. Org. Coatings, vol. 112, no. May, pp. 210–218, 2017, doi:
10.1016/j.porgcoat.2017.07.023.
[2] V. Alvarez, N. S. J. Williams, and M. Paulis, “Isolation of the interaction between CaCO3 filler and
acrylic binder. Part II: Effect of the amount and type of functional monomer,” Prog. Org. Coatings,
vol. 134, no. May, pp. 281–287, 2019, doi: 10.1016/j.porgcoat.2019.05.024.
[3] V. Alvarez, N. S. J. Williams, and M. Paulis, “Isolation of the interaction between CaCO3 filler and
acrylic binder. Part I: Effect of the surfactant and functional monomer type,” Prog. Org. Coatings, vol.
136, no. March, p. 105212, 2019, doi: 10.1016/j.porgcoat.2019.105212.
[4] U.S. Department of Health and Human Services and U.S. Department of Labor, “Occupational
Safety and Health Guideline for Calcium Carbonate.” pp. 1–7, 1995. [Online]. Available: https://www.
cdc.gov/niosh/docs/81-123/pdfs/0090.pdf?id=10.26616/NIOSHPUB81123
[5] TurkChem, “Ideal Filler Properties in Paint Formulations,” 2022. https://www.turkchem.net/idealfiller-properties-in-paint-formulations-2.html
[6] S. Kirboga and M. Öner, “Application of experimental design for the precipitation of calcium
carbonate in the presence of biopolymer,” Powder Technol., vol. 249, pp. 95–104, 2013, doi: https://
doi.org/10.1016/j.powtec.2013.07.015.
[7] S. Kırboga and M. Öner, “The inhibitory effects of carboxymethyl inulin on the seeded growth
of calcium carbonate,” Colloids Surfaces B Biointerfaces, vol. 91, pp. 18–25, 2012, doi: https://doi.
org/10.1016/j.colsurfb.2011.10.031.
[8] S. Kirboga, M. Oner, and E. Akyol, “The effect of ultrasonication on calcium carbonate crystallization in the presence of biopolymer,” J. Cryst. Growth, vol. 401, no. September, pp. 266–270, 2014, doi: 10.1016/j.jcrysgro.2013.11.048.
[9] G. Ahmed Hussein Hussein and M. B. Akın, “Investigation of Effect of the Parameters on Calcium
Carbonate Crystallization,” in The 1st International Karatekin Science and Technology Conference,
1-3 September 2022, Çankırı, Turkiye, 2022, pp. 369–373.
Asst. Prof. Dr. Muhammed Bora Akın
Çankırı Karatekin University
Faculty of Engineering
Department of Chemical Engineering
Ghassan Ahmed Hussein Hussein
Senior Operations Engineer
Northern Petroleum Refineries, Ministry of Petroleum of Iraq
Çankırı Karatekin University
Graduate School of Natural and Applied Sciences
Chemical Engineering Graduate Program

 As a result of the comparison made from the ICDD database for the synthesized materials, it is seen that the calcite peaks match with JCPDS 98-006-0995, and the vaterite peaks
match with JCPDS 98-000-6034.
It is seen that CaCO3 synthesized by using the initial reactant concentration as 0.15 M in the presence of 0.05 M PA, consists of cubic agglomerated calcite crystals (Figure 3.2a). It is seen that the surfaces of the synthesized calcite crystals by examining the SEM images are clean and smooth.
Vaterite crystals are formed as hollow spheres together with agglomerated cubic calcite crystals by using the initial reactant concentration as 0.1 M at 0.05 M PA concentration (Figure 3.2b). SEM analysis shows that there are deformations on the surfaces of the synthesized calcite crystals.
In the presence of 0.05 M PA, using the reactant concentration as 0.05 M, the mixture of calcite and vaterite forms were obtained as 0.1 M as in the experiments (Figure 3.2c). It is
also seen in SEM analyzes that vaterite spheres are formed by the agglomeration of nano-sized crystals (Figure 3.2d).
Investigating the SEM images, it appears that the average crystal size decreases when the initial reactant concentration is reduced from 0.15 M to 0.05 M.
 The BET specific surface area measurements of the obtained materials show that the specific surface area increases from 6.35 m²/g to 19.98 m²/g as the initial reactant
concentration reaches from 0.2 M to 0.1 M (Figure 3.3).
